A bow tie analysis is a risk assessment methodology that is used to visualize the potential risk exposures and outcomes related to various hazard scenarios or events.
The visual representation of conceivable risk is named “bow tie” due to its shape and consists of three parts: the causes (left), the event (center) and the effects (right).
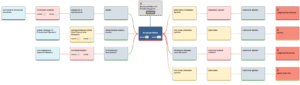
Image source: Sphera Dynamic Risk Pathways software
Thus, the bow tie analysis contains elements of a risk register and also qualifies controls that can be put in place to prevent risk sources from causing an event and any potentially cascading consequences.
In the context of process safety risk, the bow tie analysis is invaluable for assessment practices, particularly Process Hazard Analysis (PHA). The main goal of any PHA is to identify potential risks and assess the likely consequences. PHA encompasses quantitative risk analysis, which uses data input calculations, as well as the diagrammatic bow tie. Their integration within operational systems provides the real-time, dynamic aspect.
An operational risk bow tie analysis helps organizations identify and organize a spectrum of risks, from equipment failures to employee safety. Staying ahead of risks and preventing incidents enable companies to reduce downtime. Sphera offers bow tie risk assessment through Dynamic Risk Pathways, an extension of our Control of Work software.
How to Perform a Bow Tie Risk Analysis
Each part in the bow tie is associated with an activity, piece of equipment or control (layer of protection). The event that is being evaluated is at the center of the bow tie diagram. The potential hazards on the left-hand side can, individually or in combination, lead to the main event. These can propel the hazard from possible risk to catastrophe. Subsequently, the right-hand side is for the consequences of the hazard, which may be continuations of the event or additional event-like consequences of the hazard.
Although there are variations depending on the industry and application, using the bow tie methodology involves five basic steps:
- Step One – The Event: Identify your hazard and the risk event(s) in the middle.
- Step Two – Left Nodes: Work backward to pinpoint root causes or threats that could lead to that hazard/event.
- Step Three – Right Nodes: Recognize the potential impacts and consequences of the hazard and outline any possible damages.
The crucial part involves mitigation efforts.
- Step Four: Implement control measures or preventive barriers on the left to lessen the likelihood of the source threats leading to the hazard.
- Step Five: Mitigate negative outcomes by inserting recovery or control measures on the right to reduce the possible damages.
The bow tie analysis methodology is used for risk control, safety, employee compliance management and risk method analysis, among others. Additionally, using the bow tie diagram provides the operational status of the controls that are in place to mitigate the severity of potential outcomes. This is the quantitative risk assessment element that comes from the layers of protection analysis (LOPA). The LOPA methodology uses operational data to show the health of your controls or your layers of protection.
Bow Tie Risk Analysis Example
For example, suppose the hazard/event is a factory shutdown. In that case, the causes and nodes on the left side of the bow tie diagram could include safety breaches, employee vacancies, equipment malfunctions and maintenance. Between those causes and the hazard/event is where you can implement control measures, such as a maintenance schedule outside operating hours, increased safety training and routine equipment inspections.
The nodes on the right side of this bow tie would represent the impacts of a factory shutdown, including loss of revenue, compliance violations and customer dissatisfaction. These, too, require an intermediary of control measures put in place to lessen the effects of the hazard’s/event’s consequences. Examples include built-in crisis timelines communicated to customers or the addition of alternative revenue streams.
The Benefits of Bow Tie Analysis in Risk Management
The benefits of bow tie analysis include the ability to highlight vulnerabilities, model scenarios and evaluate existing controls and risk management measures. Most of what is represented in a bow tie analysis is information that is commonly understood and accepted. However, this type of diagram is a critical asset in identifying gaps and ensuring that all viable controls are in place. This risk assessment method also enables integrated and side-by-side evaluation of practice methodologies and risk management procedures.
Using the bow tie method makes it easier to educate your entire organization on the potential risks and consequences of hazardous events. Everyone can intuitively understand, process and follow any possible risk scenarios using this type of visual representation.
Sphera’s Bow Tie Analysis Software
Sphera’s Dynamic Risk Pathways brings together your organization’s disparate data sources and assembles a digital asset for real-time visualization. This leads to informed decision-making and actionable insights for risk reduction. With a fuller understanding of process safety conditions and facility health and safety status, Dynamic Risk Pathways is a proactive approach to optimizing process safety using integrated risk and bow tie analyses.
The identification of threats and consequences through bow tie risk analysis supports effective risk mitigation in dynamic working environments. With this increased visibility, organizations can enhance maintenance prioritization and asset integrity while reducing disruption and customer impact.