

When it comes to carbon accounting and decarbonization, here’s why databases based on spending can lead you to a dead-end road.
Some Background
Carbon footprints are the essential prerequisite for setting decarbonization targets and committing to actions to achieve these objectives.
While the determination of Scope 1 and 2 emissions are nowadays considered a very basic and standard procedure, the quantification of emissions throughout the value chain (Scope 3) is still a considerable challenge for most companies, despite the existence of excellent guidance such as the GHG Protocol Scope 3 Standard.
The Challenge
Procurement systems often capture purchase volumes in financial terms and without physical attributes (weight, size, number of pieces, etc.). And even if there are physical attributes available for at least some of the purchased goods and services, organizations often have no access to reliable emission factors to calculate climate impact of these purchases (representing the entire upstream value chain of an organization).
A Quick Fix
The easy fix to this is to simply use the financial numbers (e.g., purchasing volumes in dollars/euros spent) and combine these with so-called environmentally extended input-output (EEIO) tables and models. Monetary input-output tables give insight into the value of economic transactions between different sectors in an economy. They allow users to calculate the added value that each sector contributes to the final output of an economy. Such monetary input-output tables can be easily extended with environment-related information for each sector, including carbon emissions.
Particularly for Category 1 “Purchased Goods and Services” (defined as “Emissions from all purchased goods and services not otherwise included in the other categories of upstream Scope 3 emissions” by the GHG Protocol), many are using this approach. Say a company bought steel for $10 million, then you would apply this figure to an EEIO table for the sector “Primary Iron, Steel and Ferroalloy Products” and get the amount of CO₂ equivalents (CO2e) emitted. When you repeat this process for some of the major materials purchased and add them up, Category 1 of Scope 3 is complete. But is it a smart move?
Heading Down a Dead-end Road
There are several “uncertainties” associated with this approach, such as:
Time:
EEIO data generally represent a period long gone, often from 10 years ago or longer. What about changes in carbon intensity since then? Data uncertainties: Up to a factor of two or even three.
Prices:
The nature of markets is that prices vary over time. Even if updated EEIO tables were available, they could not accurately represent the actual prices you paid for your materials. Steel? Check out the 10-year price history graph for steel below (anywhere from about $235 to $940). Fuels? Same. Lumber? Sugar? Same. Data uncertainties of up to ±80% are not uncommon.
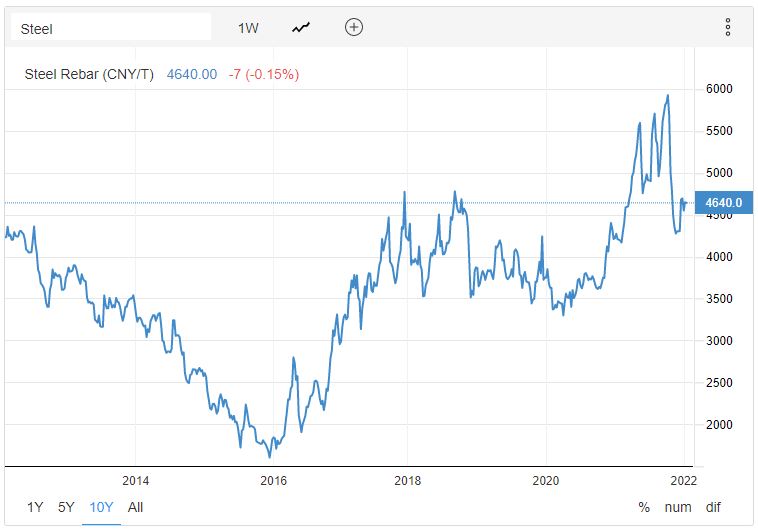
Source: trandingeconomics.com
Precision:
What kind of steel did you buy? What kind of alloy? Where did it come from? How was it produced? How much recycled content does it have? Many parameters influence the carbon emissions associated with the production of the materials you buy. EEIO won’t help you here. Data uncertainty? Up to a factor of 10.
Add up these uncertainty ranges, and we are talking orders of magnitude. This type of approach may be suitable for a first, very rough, screening, and for a rough estimation of Scope 3 categories that are not relevant for a particular organization.
But the approach is not suitable as a foundation and starting point for your journey to reduce carbon emissions and track these reductions. Once a Scope 3 analysis is done, companies need to be able to answer the question: Where can we reduce our Scope 3 emissions? This is when you will realize that an EEIO-derived baseline is definitely not as accurate as needed to set up reduction targets and actions. In addition, it does not allow to even guess where there are reduction potentials, how big they are and where you might have the biggest leverage. The entire project is a launch failure, or a dead-end road if you prefer an automobile analogy.
What’s the Solution?
Calculating Scope 3 emissions precisely requires using physical attributes such as weight, size, number of pieces etc. This is then followed by connecting these data points with high-quality emission factors on the material (and/or process) level, such as Lifecycle Impact Assessment (LCIA) databases with annually updated real-industry data selected by sector and material-specific sustainability experts. Once these emissions are assessed based on LCIA data for each material or component, they can be scaled to commodities and overall purchasing volumes.
Based on this material quantification of CO2 emissions, reduction potentials can be further analyzed . The benefits of having this level of detail are worth the effort if getting meaningful and actionable data is the objective. A true carbon reduction strategy comprising value chain emissions includes the assessment of alternative production routes and technologies, materials or activities such as the use of green electricity and sourcing options. Here, companies also require deep, multisector Lifecycle Assessment (LCA) expertise as well as professionals who can identify hotspots and alternative emission reduction pathways. They can help assess and quantify carbon reductions, compare technologies and provide insights on feasibility, timeline and costs for implementing those measures.
The secret to success lies in the clear quantification of the reduction potential on a detailed, physical and scientific basis. This will help steer the organization along its strategic decarbonization pathway.
You may ask yourself then why are relevant standards and frameworks tolerating such screening-level EEIO data. There are several reasons, from low-barrier entry to heavy lobbying by some. However, previously mentioned, this will lead to a dead-end-road. More details on this topic can be found in The SBTi’s Net-Zero Standard–Are Promises Being Kept? (under ‘Missing Pieces’) and in 6 Data Characteristics for Achieving Net-Zero Emissions Targets.